Interpretation of bone analysis parameters in Micro CT
I. Background brief
MicroCT is a combination of imaging techniques for non-invasive and histological detection of high-resolution features. Because CT and other body tissues have relatively significant differences in X-ray attenuation performance, Micro CT is particularly suitable for bone imaging, bone parameters. Research is also one of the important application areas of MicroCT.
In the previous article, we shared some examples of micro CT in bone analysis, and today we will introduce the bone analysis parameters in Micro CT.
Second, the interpretation of bone analysis parameters

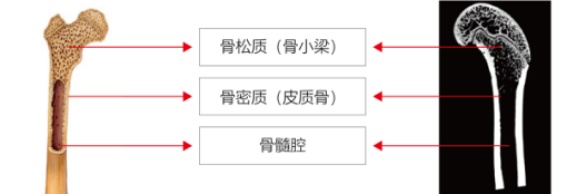
The bone is composed of bone, periosteum, bone marrow, bone blood vessels, lymphatic vessels and nerves. In Micro CT, in-depth morphological analysis and research can be performed on the bone mass. The bone is densely divided and loose: the bone is densely distributed on the surface of the bone, also called the cortical bone; the cancellous bone is arranged by the trabecular bone, which is arranged inside the bone, and the arrangement of the trabecular bone and the bone are endured. The pressure and tension are in the same direction and can withstand large weights. The bone marrow cavity and the cancellous space are filled with bone marrow. [1]
With the image processing software, the region of interest (ROI) can be selected as the threshold segmentation on the scan image of Micro CT, and the cortical bone and cancellous bone can be segmented and extracted into different tissue regions. Various morphological characteristics of cortical bone and cancellous bone (trabecular bone) were studied and analyzed, and parameters for characterizing bone growth and development were obtained (see Table 1).
With the image processing software, the region of interest (ROI) can be selected as the threshold segmentation on the scan image of Micro CT, and the cortical bone and cancellous bone can be segmented and extracted into different tissue regions. Various morphological characteristics of cortical bone and cancellous bone (trabecular bone) were studied and analyzed, and parameters for characterizing bone growth and development were obtained (see Table 1).
Table 1. General bone analysis parameter table
| Indicator name | Shorthand | unit | Interpretation and meaning | |
| General parameters | Bone surface area | BS | Mm2 | Bone tissue surface area calculated by triangulation of bone tissue by a moving cube algorithm |
| Tissue volume | TV | Mm3 | Refers to the total volume of the region of interest, which is determined primarily by the investigator or the study focus area | |
| Bone volume | BV | Mm3 | Refers to the volume defined as bone tissue in the region of interest | |
| Bone surface area bone volume ratio | BS/BV | 1/mm | Indicates the size of the unit volume of bone tissue | |
| Bone surface area tissue volume ratio | BS/TV | 1/mm | Also known as bone surface area density, can indirectly reflect the amount of bone | |
| Bone volume fraction | BV/TV | % | Indicates the ratio of bone tissue volume to tissue volume, which can directly reflect changes in bone mass | |
| Bone mineral content | BMC | Mg | Indicates the mass of bone minerals contained in the bone tissue of the region of interest | |
| Bone mineral density | BMD | g/cm3 | Indicates the density of bone minerals in the bone tissue of the region of interest | |
Under normal circumstances, BV and bone volume fraction BV/TV can reflect the amount of bone when comparing the bone tissue (TV) of the region of interest of the subject; bone surface area ratio (BS/BV) and bone surface area tissue volume ratio (BS/TV), which can indirectly reflect the amount of bone; bone and fraction (BV/TV) are commonly used indicators for the evaluation of cortical bone and cancellous bone mass. For cancellous bone in the medullary cavity, the ratio can reflect differently. The amount of bone trabecular bone in the sample indicates that bone anabolism is greater than catabolism, bone mass is increased, and vice versa, which can indirectly reflect bone metabolism. It has the same value in evaluating the amount of bone bone and bone metabolism in the middle of long bone.
Further, with the phantom whose main component is hydroxyapatite, the bone mineral density of the cortical bone/cancellous bone can be calculated and analyzed according to the imaging gradation value of the phantom in Micro CT (TMD, Tissue Mineral Density) Or bone mineral density (BMD, Bone Mineral Density). Because the total mineral content and mineralization of bone tissue are greatly different due to factors such as anatomical location, growth state, gender and age, it is of great value for bone research. Micro CT can not only quickly obtain the BMD of the sample, but also will not destroy it. Bone tissue specimen structure, which is significantly superior to traditional methods for assessing mineralization (such as quantitative microscopy, scattered electron microscopy, and ash content) [2].
Further, with the phantom whose main component is hydroxyapatite, the bone mineral density of the cortical bone/cancellous bone can be calculated and analyzed according to the imaging gradation value of the phantom in Micro CT (TMD, Tissue Mineral Density) Or bone mineral density (BMD, Bone Mineral Density). Because the total mineral content and mineralization of bone tissue are greatly different due to factors such as anatomical location, growth state, gender and age, it is of great value for bone research. Micro CT can not only quickly obtain the BMD of the sample, but also will not destroy it. Bone tissue specimen structure, which is significantly superior to traditional methods for assessing mineralization (such as quantitative microscopy, scattered electron microscopy, and ash content) [2].
2.1 Analysis of trabecular bone and structural parameters
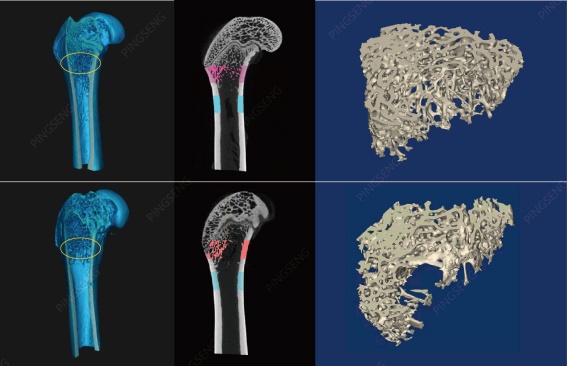
The trabecular bone is the extension of the cortical bone in the cancellous bone, that is, the trabecular bone is connected with the cortical bone, and has an irregular three-dimensional network structure in the bone marrow cavity, such as loofah or sponge, which plays a role in supporting hematopoietic tissue. . The porous grid structure formed by the trabecular bones is regularly arranged according to the stress curve and has non-uniform anisotropy. This arrangement can increase the bone strength. It can be said that the bone quality of the trabecular bone is closely related to its microstructure. 3]. Therefore, microstructural analysis of trabecular bone is very important in bone analysis. Micro CT can perform non-destructive 3D imaging of the trabecular microstructure and demonstrate the microstructure of the trabecular bone, making it possible to perform topological analysis of the trabecular microstructure.
The trabecular bone number (Tb.N), trabecular thickness (Tb.Th) and trabecular bone separation (Tb.Sp) can be calculated from the microstructure of the trabecular bone. These are the evaluation of the spatial morphological structure of the trabecular bone. The main indicator. In the case where bone catabolism is greater than bone anabolism, such as when osteoporosis occurs, the values ​​of Tb.N and Tb.Th decrease; the value of Tb.Sp increases. (Note: Further, these parameter analyses can be extended to the study of porous materials. The Tb.Th and Tb.Sp values ​​can be understood as pore wall thickness and porosity.)
The trabecular model factor (Tb.Pf), degree of anisotropy (DA), and trabecular junction density (Conn.D) are also important parameters for the expression of bone status.
For example, 1) the trabecular model factor (Tb.Pf) is used to describe the degree of bulge on the surface of the trabecular bone. It is related to the structural mode index (SMI), which is a parameter describing the ratio of the slab structure and the rod structure in the trabecular structure. . If the trabecular bone in the structure is mainly a lamellar structure, the SMI is close to zero; conversely, if it is mainly a rod-shaped trabecular bone, the SMI is close to 3. When osteoporosis occurs, the trabecular bone changes from a plate shape to a rod shape, and this value increases. 2) The degree of anisotropy (DA) is used to evaluate the directionality and symmetry of the trabecular bone, and refers to the ratio of the long diameter to the short diameter in the mean ellipsometric length (MIL). The greater the degree. In the early stage of osteoporosis, the DA value of the load-bearing trabecular bone usually increases, and as osteoporosis increases, DA decreases. 3) The trabecular junction density (Conn.D) represents the number of connections between the trabecular meshwork structures per cubic millimeter of volume.
In the scan imaging results of Micro CT, these parameters can be analyzed to study the strength and bone quality of the trabecular bone.

Figure 1. Comparison of trabecular bone under the NEMO® Micro CT scan of Pingsheng Company (top: normal rat femoral trabecular bone; lower: osteoporotic rat femoral trabecular bone)
Table 2, trabecular analysis parameter list
Table 2, trabecular analysis parameter list
| Indicator name | Shorthand | unit | Interpretation and meaning | |
| Trabecular analysis parameters | Number of trabecular bone | Tb.N | 1/mm | Means the average number of intersections of bone and non-bone tissue per mm in the region of interest |
| Trabecular thickness | Tb.Th | Mm | Indicates the average thickness of the trabecular bone | |
| Trabecular bone separation | Tb.Sp | Mm | Mean width of the medullary cavity between the trabecular bone | |
| Trabecular model factor | Tb.Pf | 1/mm | It is an indicator of the degree of trabecular bone connectivity and is relatively convex or concave. This decrease in the value indicates that the trabecular bone changes from a rod shape to a plate shape, and Tb.Pf increases when osteoporosis occurs, that is, the trabecular bone changes from a plate shape to a rod shape. | |
| Structural model index | SMI | -- | Describe the parameters of the lamellar structure and the ratio of the rod-like structure in the trabecular structure. If the trabecular bone in the structure is mainly a lamellar structure, the SMI is close to 0; otherwise, if it is mainly a rod-shaped trabecular bone, the SMI is close to 3 | |
| Degree of anisotropy | DA | -- | Used to evaluate the directionality and symmetry of trabecular bone | |
| Trabecular connectivity | Connectivity | -- | Indicates the number of connections between the trabecular meshwork structures in the region of interest | |
| Trabecular connection density | Conn.D | 1/mm3 | Indicates the number of connections between the trabecular meshwork structures per cubic millimeter of volume | |
| Fractal dimension | FD | -- | Used to evaluate the irregularity and complexity of trabecular bone | |
2.2 Cortical bone analysis and related parameters
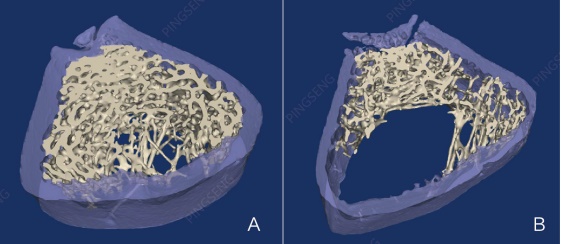
There are few studies on cortical bone relative to trabecular bone. However, studies have shown that in the occurrence of osteoporosis, the cortical bone will bear more intensity load, and the intrinsic nature and porosity of the cortical bone itself affect the change of bone strength. Under stress, the cortical bone changes later than the trabecular bone. At first, the cortical bone width increases, the thickness becomes thinner and stratified, and then loose, and finally can be thin, and the corresponding bone density test also confirms this. Therefore, parametric analysis of cortical bone is also beneficial for a comprehensive understanding of bone growth and bone disease.

Figure 2. Comparison of cortical bones under the NEMO® Micro CT scan of Pingsheng Company (purple part on the left: femur cortical bone in normal rats; purple part on the right: femoral cortical bone in osteoporosis rats)
In addition to the general parameter calculations, the following indicators can be obtained in the cortical bone analysis: total cortical bone area (Tt. Ar), cortical bone area (Ct. Ar), cortical bone thickness (Ct. Th), and medullary cavity area (Ma). .Ar). Increased total cortical bone area (Tt. Ar) indicates an increase in bone formation; cortical bone area (Ct. Ar) can reflect changes in internal and external bone surface; bone marrow cavity area (Ma.Ar) can reflect endosteal bone resorption The situation [4].
Table 3, Cortical bone analysis parameter table
| Indicator name | Shorthand | unit | Interpretation and meaning | |
| Cortical bone parameters | Total area of ​​cortical bone | Tt.Ar | Mm2 | The total area of ​​the cortical bone cross section |
| Cortical bone area | Ct.Ar | Mm2 | Average cross-sectional area of ​​the cortical bone cross section | |
| Cortical bone thickness | Ct.Th | Mm | Average thickness of cortical bone in the region of interest | |
| Cortical bone area to total area ratio | Ct.Ar/Tt.Ar | % | Indicates the ratio of the average cross-sectional area to the total area of ​​the cross-section of the cortical bone | |
| Bone marrow cavity area | Ma.Ar | Mm2 | Mean cross-sectional area representing the bone marrow cavity in the bone tissue of the mid-section bone | |
Third, summary
In the field of bone tissue research, Micro CT can well study the quantitative indicators and microscopic changes of bone structure and bone density, and can guide scientific research in tissue engineering, genetic engineering, etc., and has gradually developed into a one that can strengthen or even replace histological analysis. A mature technology, Micro CT has broad market prospects in a wide range of applications, and will also bring new development opportunities for research in various disciplines.
Note:
- Wang Yunqi et al. Bone and Joint Imaging (2nd Edition). Science Press, 2010.7
- Wei Zhanying, Zhang Zhenlin. Interpretation and application value of bone microstructural index in bone metabolism research by Micro-CT. Chinese Journal of Osteoporosis and Bone Mineral Disease [J], 2018(2): 200-205;
- Qi Qing;Wang Tianmiao;Wang Junqiang. Biomechanical comprehensive analysis of micro-bone trabecular structure of cancellous bone. Journal of Beijing University of Aeronautics and Astronautics [J], 2008(02): 215-218.
- [4]. Bone histomorphometry is currently applied by experts. Chinese Journal of Osteoporosis. 2014, 20(9): 1031-1038.
Hydrocolloid Applicator,Hydrocolloid Dressing,Hydrocolloid Band Aid,Hydrocolloid Gel Patches
Henan Maidingkang Medical Technology Co.,Ltd , https://www.mdkmedicales.com
